ninonbooks
DIAGRAMS: A Visual Survey of Graphs, Maps, Charts and Diagrams for the Graphic Designer

情報の効率的な伝達のために用いられる「ダイアグラム」の包括的なガイドブック。
棒グラフ、折れ線グラフ、円グラフといった基礎的チャートから、組織図、フローチャート、ネットワーク図、系統樹、地図、タイムラインなど、多様な種類のダイアグラムを体系的に分類し、それぞれの視覚的特性、情報の表現力、そして具体的な応用例を詳細に解説しています。
目次
- 1. Statistical diagrams
- Line graph
- Logarithmie graph
- Scatter graph
- Bar graph
- Population pyramid
- Bar diagram
- Block diagram
- Divided Rectangle
- Circular graph
- Divided circle (pie or cake graph)
- Pictorial graph
- 2. Explanatory and statistical maps
- Weather map
- Route map
- Games and battles
- Colour
- Texture and shading
- Line and tone
- Dots and circles
- Symbols
- Distorted map (cartogram)
- Ray map
- Flow line map
- 3. Explanatory diagrams
- Flow chart
- Technical
- Organization chart
- Botanical/medical
- Family tree
- Tabulation
- Time chart
- Techonique
- Three dimensions
- Engineering drawing
- 著者
- Arthur Lockwood(著)
- 発行
- Watson-Guptill Publications, 1969年
- サイズ
- 220x278mm, ハードカバー, 144ページ, 英文
- 状態
- C, カバー端破れ, 経年ヤケシミ
- 価格
- ¥9,900(税込)
- タグ
関連書籍
グラフィックデザイン 32
勝見勝(編), ¥4,500
Envisioning Information
Edward R. Tufte(著), ¥6,600
「ダイアグラム教育」展図録
太田徹也(編集・デザイン), ¥2,200
TOKYO ACCESS / 東京アクセス 英語と日本語で読むユニークなシティマニュアル
リチャード・ソール・ワーマン(著), ¥6,600
絵画図表の見方・画き方
ルドルフ・モドレイ(著)
グラフィックデザイン 42
勝見勝(編)
世界の表象: オットー・ノイラートとその時代
寺山祐策(編), ¥9,900
Otto Neurath : The Language of the Global Polis
Nader Vossoughian(著)
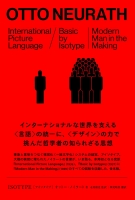
ISOTYPE [アイソタイプ]
オットー・ノイラート(著)
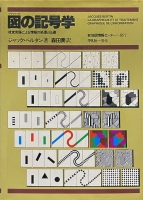
図の記号学 : 視覚言語による情報の処理と伝達
ジャック・ベルタン(著)
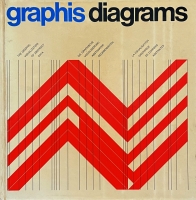
Graphis Diagrams : The Graphic Visualization of Abstract Data
Walter Herdeg(編), ¥12,000
Understanding USA
Richard Saul Wurman(著), ¥3,850
Loading...